[DevOps] Prometheus监控告警——实战篇
目录
上一篇我们用Docker单机运行了一套Prometheus监控系统,但不足以应用到生产环境,主流方式是用Prometheus Operator在Kubernetes集群中部署。本篇我们就从Prometheus Operator开始,以三个典型问题为例,讲解在生产环境中使用Prometheus系统的实战经验。
(阅读本篇需要一些Kubernetes的背景知识)
一:声明式管理监控告警系统
Prometheus Operator是CoreOS的一个开源项目,用来增强Prometheus在Kubernetes中的管理运维能力。利用Kubernetes的自定义资源定义 (Custom Resource Definition)的特性,实现声明式管理运维Prometheus监控告警系统。
部署和配置Prometheus Operator
常用的部署Prometheus Operator的方式有两种:
- Helm Chart部署
- 直接用Kubectl命令Apply配置清单:Manifest。
Helm中心仓库的PrometheusOperator Chart,在2020年9月已经不维护了,新的Chart在Prometheus Community的Repo中,叫 kube-prometheus-stack,使用时需要先添加该Repo。
1 | helm repo add prometheus-community https://prometheus-community.github.io/helm-charts |
该Helm Chart与其他Chart类似,把大量参数封装了,要深入使用仍要一个一个参数阅读,定制Values文件的参数来部署一套符合需求的监控告警系统。
因此如果想定制的参数不在Helm Values中,仍然需要修改Chart中的模板文件。所以有时候返璞归真,直接用静态Yaml直接Apply到集群也是一个不错的办法。
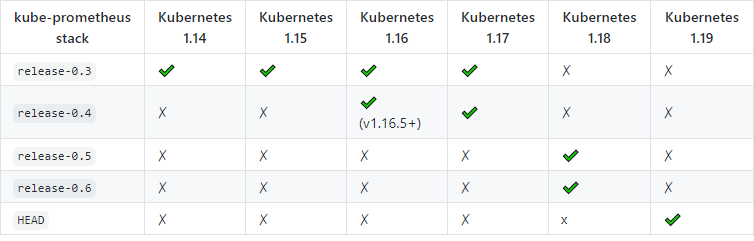
我个人更喜欢第二种方式,克隆kube-prometheus项目,在Readme中找到与Kubernetes对应的版本(如下图),切到对应的Git Branch修改定制的参数后,执行命令即可。
git clone https://github.com/prometheus-operator/kube-prometheus.git
git checkout release-0.6 # 视情况而定
kubectl apply -f manifests
其中要改的参数有:服务入口的Ingress配置、存储的PersistentVolume、定制的监控端点、告警通道等等,阅读Manifests的Yaml代码大概就明白了。
使用 Operator CRD 创建监控告警
部署的过程中,除了会自动创建Prometheus Operator、Prometheus Adapter、Kube-state-metrics、Grafana等组件,以及相关的ServiceAccount/Role/RoleBinding/ConfigMap/Secrets之外,还会创建一些Kubernetes CRD:
- Prometheus: prometheuses.monitoring.coreos.com
- PrometheusRule: prometheusrules.monitoring.coreos.com
- ServiceMonitor: servicemonitors.monitoring.coreos.com
- PodMonitor: podmonitors.monitoring.coreos.com
- AlertManager: alertmanagers.monitoring.coreos.com
- ThanosRuler: thanosrulers.monitoring.coreos.com
Prometheus和AlertManager这两个CRD部署的时候就自行生成了,用来自动创建PrometheusServer和AlertManager的StatefulSet,几乎不需要额外修改,常用的需要修改的CRD是:ServiceMonitor、PrometheusRules。
ServiceMonitor是对Scrape Config的抽象,利用Kubernetes的selector机制非常灵活地选取监控端点,比如下面这个Prometheus自监控的ServiceMonitor的配置。
1 | apiVersion: monitoring.coreos.com/v1 |
该ServiceMonitor Apply到集群后,Prometheus配置中会生成一个这样的Scrape Config。
1 | - job_name: monitoring/prometheus/0 |
PrometheusRule是对Record Rule/Alert Rule的抽象,在做告警规则时经常使用。
1 | apiVersion: monitoring.coreos.com/v1 |
这个Yaml文件Apply到集群后,会生成一个AlertRule,本例中“MyService”的uptime指标持续15秒不见的时候(absent),触发告警。
了解这些CRD的使用后,我们就能声明式管理监控告警系统,以及系统中的监控端点和告警规则等配置了,配置的修改也会自动加载,无需手动重启。
二、细粒度监控指标
单独部署的Exporter自带的监控指标,通常是不够的,编程语言、框架的Runtime指标、业务服务自定义的监控指标都非常关键。比如JVM中的线程池监控、某业务执行时间监控等等,下面来看看实战中怎么更进一步,集成更多的细粒度监控指标。
场景1:Prometheus监控Java SpringBoot应用
Step1:集成SpringBoot Actuator
SpringBoot Actuator是SpringBoot自带的应用监控管理组件,配合SpringBoot Admin可以实现一整套对微服务的监控管理,启用Actuator只需要添加一个依赖(Gradle形式):
“org.springframework.boot:spring-boot-starter-actuator”
Step2:再添加Prometheus Registry的依赖
“io.micrometer:micrometer-registry-prometheus”
这个jar实现了自定义的Actuator Endpoint(**/actuator/prometheus**),部署后在Prometheus Server上添加静态配置或自动发现规则,即可监控到服务端点,刮取/actuator/prometheus下的Metrics数据。
注:Actuator里面有很多非常敏感的API,比如/threaddump /heapdump /shutdown,一般在非本地环境都会配置关闭,比如只启用这几个,并且在入口做IP或者URL的访问限制。
1 | # application.yaml |
Step3:JVM指标可视化
应用服务部署后,创建PodMonitor或自定义发现规则,收集到Prometheus中,再到Grafana中导入 JVM Micrometer(4701), Spring Boot Statistics(6756) 这两个Dashboard。
另一个常用的Java应用集成方式是在JVM启动时指定开启JMX,搭配JMX Exporter收集JVM监控数据,虽然可靠性更佳,但扩展性不如actuator,建议在传统非SpringBoot基础上的Java服务上使用JMX Exporter。
Step4:利用Micrometer添加自定义监控指标
SpringBoot Actuator使用的是Micrometer。Micrometer之于PrometheusRegistry就像Slf4J之于Log4j/Logback, 也就是说Micrometer与Slf4J一样,提供了一套监控Facade,不关心真正的实现(MetricsRegistry)是什么。
因此我们调用Micrometer的API即可实现自定义监控,真正的实现类在micrometer-registry-prometheus,即使不用Prometheus,换一个Registry的依赖即可。
Spring官方博客有关于这方面的介绍:https://spring.io/blog/2018/03/16/micrometer-spring-boot-2-s-new-application-metrics-collector
最简单的用法,可以将Micrometer中的TimedAspect类添加到Spring容器,TimedAspect自带的AOP注解@Timed,添加到被动态代理类的方法上就能实现方法执行时间监控。
1 |
|
1 | // 在方法上添加 @Timed 注解即可 |
启动服务后,访问本地的/actuator/prometheus接口,就能看到如下的指标数据了,其中就有我们自定义的”my_method_execution”的三个指标(count sum max)。
1 | # HELP my_method_execution_seconds |
如果不用自带的@Timed注解,也可以查阅文档调用Micrometer的API,下面是创建一个Gauge的例子。
1 | createGauge(someObj, "my_gauge", "Customized Gauge to monitor something", someObj -> (double) someObj.getRealTimeMetricsData()); |
场景2:Prometheus监控Node.js服务
Node.js表示:我们不学Java界搞花里胡哨的针对接口编程、过度封装,要接入Prometheus直接2行代码搞定!
Step1:集成prom-client
1 | // npm i prom-client |
这里用到的prom-client是一个Node.js的Prometheus客户端的开源实现,我读完源码后,一开始担心对象keys遍历的操作和精确的纳秒时间获取会不会性能不高,对比压测之后发现对普通的HTTP接口的性能影响在5%以内,可以放心使用。
再后来想明白,源码用process.hrtime()而不是Date.now()是有深意的, 因为NodeJS中Date.now()/new Date()并不一定是准确时间,而process.hrtime()可以获取机器的精确到纳秒的时间,虽然性能与Date.now()差了一个数量级,但这对监控方法执行时间是必要的!
Step2:收集指标数据及可视化
同样,定义ServiceMonitor或配置Scrap Config将时序数据收集到Prometheus。
再到Grafana导入我开发的Node.js Dashboard(11159): https://grafana.com/grafana/dashboards/11159,即可看到丰富的Node.js运行时监控了,最关键的有:EventLoop的延迟,V8的内存等等。
Step3:自定义指标
以koa2 + TypeScript为例,下面这些代码能给每个HTTP接口自动加上计时监控,访问/metrics接口获取监控数据。
1 | import { yourRouter} from './routes'; |
场景3:Prometheus监控Golang服务
Step1:集成client_golang库
Prometheus官方提供了Golang的Client Library(https://github.com/prometheus/client_golang),毕竟Prometheus本身也是Golang写的,集成方式也非常简单,把client_golang自带的Handler注册到路由中即可。
1 | package main |
可视化 Grafana可以使用 Golang Go Processes(6671) 这个Dashboard。

Step2:Golang应用自定义监控指标
自定义指标也可以参考client_golang的示例代码:https://github.com/prometheus/client_golang/blob/master/examples/random/main.go。
大致流程如下所示,创建指标、注册到Registry中、再随程序运行记录指标值。
1 | func main() { |
三、监控告警系统的高可用
在实际使用中,除了经常需要定制监控指标外,还需要考虑监控告警系统自身的可用性。我们用Prometheus Operator部署,PrometheusServer和AlertManager默认都是高可用的。默认情况下,Prometheus是两个实例,AlertManager是三个实例,多个部署实例在原理上是如何做到高可用的呢?
Prometheus系统自身的高可用
两个Prometheus实例是各自独立抓取所有指标。也就是说每个监控端点会被重复抓取,冗余存储在两个Prometheus Server实例绑定的PersistentVolume中,由于单盘容量有限,一般不会保存太久。
这种方式的高可用在单集群已经足够了,但如果不想直接存在硬盘或需要接入多集群数据,可以配置Remote Write,比如写入InfluxDB。以此将数据存储的扩展性和高可用问题移到了Prometheus系统外部,用其他方案解决。
仅仅配置一个Remote Write性能会打折扣,如果不是为了兼容其他系统一般不会这么做。Prometheus开源生态体系中有一个Thanos项目,提供了多集群长期存储的整套解决方案,具体细节这里有一篇文章讲解。这种高可用方案更加完备,但也为弹性能力引入了额外的复杂度,适用于多集群超大量的监控数据存储。
另外,AlertManager本身使用Gossip协议防止重复告警,具体原理下一篇会讲。因此这样一套单集群监控告警系统就自身组件没有单点了,但多数据中心、多集群的场景会更加复杂,以后再展开讨论。
自监控与Watch Dog
部署多个实例不代表100%可用,极端的例子是整个数据中心都宕机了。那么,监控系统怎么知道监控系统是正常工作呢?
一方面,可以从自监控入手,比如内部组件之间互相监控,甚至多数据中心之间互相监控巡检;另一方面可以利用Watch Dog机制,一般专业的告警通知渠道(比如PagerDuty)都有这类机制,没有的话也可以二次开发实现。
Watch Dog在硬件领域指的是一个独立运行的计时器电路,主程序未能及时清除计时器,就说明主程序可能不正常了,Watch Dog触发重启等指令。
在监控告警系统中的Watch Dog含义也类似,大概流程是这样的:
- Prometheus会一直触发一个特殊的告警,告诉第三方告警通知渠道,“我还能报警,我没有挂”;
- 接收方过滤掉这条消息不予发送,并重置计时器;
- 一旦超过一段时间,还没有收到这条空告警消息,就说明AlertManager到消息发送系统之间的链路断了;
- “看门狗”叫起来,发出告警消息。
要使用Watch Dog机制,创建一个vector(1)的Alert Rule到Prometheus,再配置或开发告警渠道即可。
1 | - alert: Watchdog |
多渠道告警
高可用不只是内部没有单点,可用性需要考虑到整个业务流程上的每一个环节。如果消息通知渠道同时也挂了怎么办呢?
我们的服务可能会挂,微信也可能会挂,邮件服务也可能会挂,虽然它们同时挂掉的可能性极低。
监控系统的末端——消息通知渠道,也应该不是单点。解决方案一般是在AlertManager配置多渠道冗余告警,来保障告警消息的可达性。
小结
本篇主要讲解了生产环境中使用Prometheus监控告警系统最常见的三个问题:
- 在Kubernetes中用Prometheus Operator声明式管理运维监控告警系统
- 不同编程语言和框架中自定义监控指标,实现细粒度监控
- 监控告警系统的高可用实现
下一篇,我们深入源码寻找Prometheus系统关键流程的代码实现,了解底层技术原理。